Check Apex Code Coverage Across All Classes and Triggers
Published: Nov 12 2026
Quick Answer:
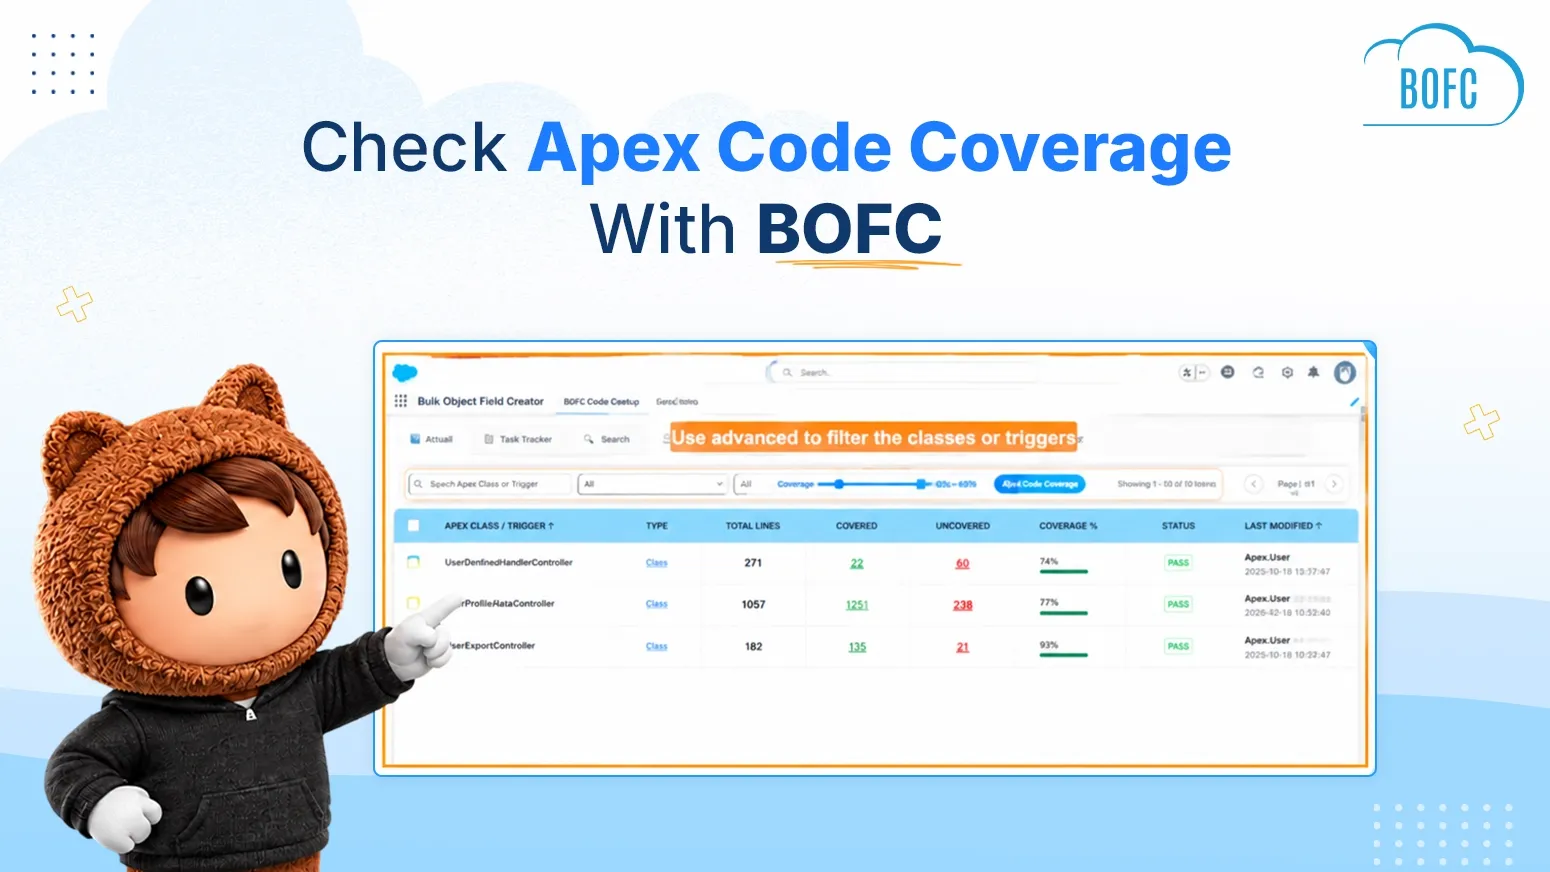
To check Apex code coverage across salesforce orgs, open BOFC Home in your Salesforce org and navigate to Dev Console → Code Coverage. BOFC displays coverage percentages for Apex classes and triggers on a single screen, along with covered and uncovered lines highlighted in green and red, respectively. You can also use advanced filters to search components by name, status, or coverage percentage range. This makes it easier to identify coverage gaps, review Apex test coverage, and prioritize components that need additional testing without manually opening each class or trigger.
Apex code coverage is an important part of Salesforce development. It helps developers understand how much of their Apex code is executed by test methods and identify areas that need additional testing before deployment.
However, reviewing apex code coverage across multiple classes and triggers can involve several steps. Developers often need to navigate test results, open individual classes, and inspect covered and uncovered lines to understand where improvements are needed.
For example, how do you quickly identify which Apex classes have low test coverage? Or find the uncovered lines in multiple classes without checking each one individually?
Salesforce provides code coverage information through the Developer Console, Setup, VS Code, and other development tools. However, getting a consolidated view of coverage and inspecting individual components can still involve additional navigation.
BOFC’s Code Coverage feature simplifies this process by displaying coverage information for Apex classes and triggers on a single screen, along with covered lines, uncovered lines, percentage details, and advanced filters.
In this guide, we’ll explore how Salesforce code coverage works, the challenges of reviewing it manually, and how to use BOFC Dev Console to check Apex code coverage more efficiently.
The Problem: Reviewing Code Coverage Across Classes
Salesforce generates code coverage information when Apex tests are executed. Developers can review the results through the Developer Console, including overall coverage information and line-level details for individual classes.
However, when working with a large Salesforce org containing numerous Apex classes and triggers, reviewing this information can involve additional effort.
Some common challenges include:
- Limited consolidated visibility: Although Salesforce provides overall coverage information, reviewing individual classes and triggers and their line-level coverage requires additional navigation.
- Dependence on test execution: Coverage information is generated from test execution results. When Apex code changes, tests must be rerun to refresh the coverage information.
- Difficulty identifying coverage gaps: Finding specific classes or triggers with low coverage can require reviewing individual components and their test results.
- Time-consuming code inspection: Developers often need to open individual classes to identify which executable lines are covered and which remain uncovered.
For Salesforce teams managing large orgs, regularly reviewing coverage across multiple components can become a repetitive task.
This is particularly important before production deployments, where Salesforce requires at least 75% overall Apex code coverage, successful tests, and some test coverage for every trigger.
How BOFC Simplifies Apex Code Coverage Monitoring
BOFC introduces a dedicated Code Coverage feature within its Dev Console that brings Apex class and trigger coverage information into one centralized screen.
Instead of navigating through individual components to review their coverage, developers can see coverage percentages, covered lines, uncovered lines, and component status together.
Here are the key capabilities:
- Centralized Coverage Overview: View coverage information for Apex classes and triggers on a single screen instead of navigating between individual components.
- Covered and Uncovered Line Details: Identify covered lines highlighted in green and uncovered lines highlighted in red, making it easier to locate areas that need additional testing.
- Coverage Percentage Details: Review the percentage of covered lines for individual Apex classes and triggers.
- Advanced Filtering: Search components by name, filter by Pass or Fail status, and narrow down results using coverage percentage ranges.
- Faster Coverage Reviews: Identify components with lower coverage and prioritize them for additional testing without manually opening every class or trigger.
With these capabilities, developers can get a clearer picture of Apex code coverage across their Salesforce org and focus on the components that need attention.
How to Check Apex Code Coverage Using BOFC Dev Console
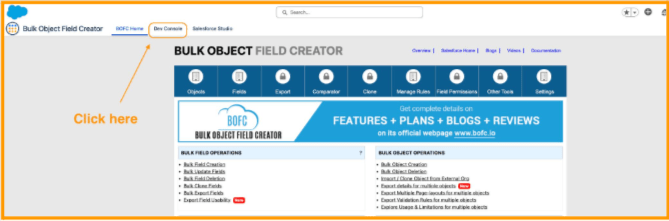
Step 1 : Open BOFC In Salesforce, click the App Launcher (nine dots) and search for “BOFC Home.” Then click the Dev Console tab next to it.
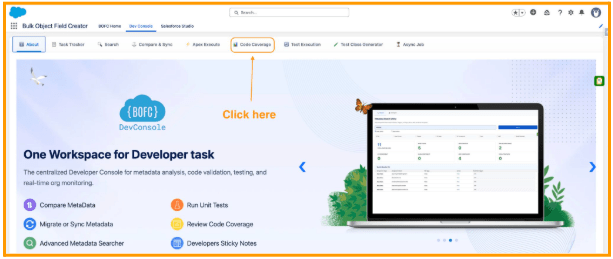
Step 2 : Navigate to “Code Coverage” feature tab
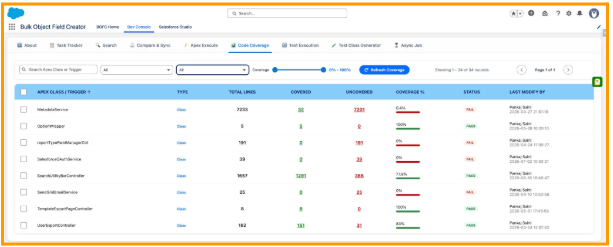
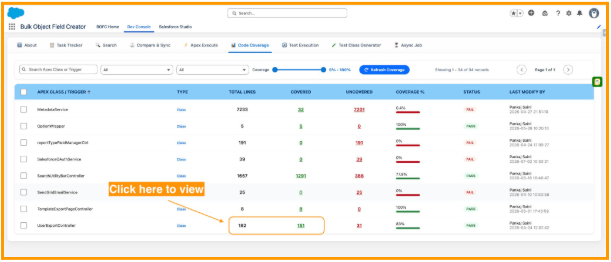
Step 3 : View the coverage overview BOFC displays a single screen listing all Apex classes and triggers, along with their coverage status.
Covered / Uncovered lines with % coverage details.
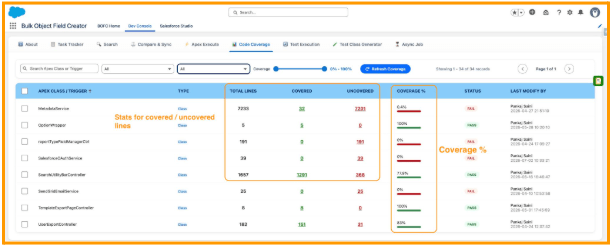
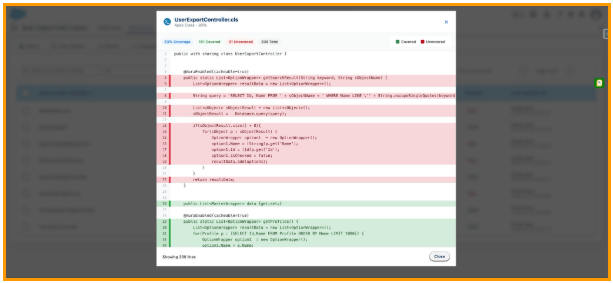
Step 4 : Identify covered vs. uncovered lines. For any class or trigger from the list to see its code with covered lines highlighted in green and uncovered lines highlighted in red, click on the numbers and it will display the required coverage.
Prioritize and fix Use the highlighted uncovered lines as a direct guide for where to add or improve test coverage, instead of guessing which parts of the class still need tests.
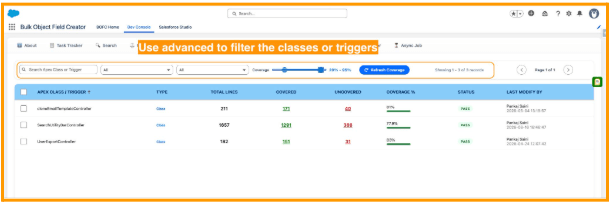
Step 5 : Spot classes below threshold Scan the overview screen to quickly identify which classes or triggers fall below your required coverage percentage (e.g., under 75%) using the percentage scrollers and other advanced filters.
Advanced filters include:
- Search classes or triggers by name
- Search classes or triggers by Status (Pass or Fail)
- Filter classes or triggers by coverage scrollers (eg: 10 to 40, or 20 to 60)
When Should You Review Apex Code Coverage?
Regularly reviewing Apex code coverage can help Salesforce developers in several situations.
- Before Production Deployments: Review overall Apex coverage and identify components that need additional testing before deployment. Remember that Salesforce’s 75% requirement applies to overall Apex coverage, while every trigger must have some coverage.
- Working With Unfamiliar Salesforce Orgs: Quickly understand the existing coverage status of Apex classes and triggers when taking over an existing Salesforce project.
- Writing and Improving Test Classes: Use uncovered line details to identify code that needs additional test execution and improve test methods accordingly.
- Ongoing Code Maintenance: Periodically review coverage information to identify components that need attention as your Salesforce org evolves.
Final Thoughts
Comparing code across Salesforce orgs is an important part of maintaining consistency between development, sandbox, and production environments. However, manually retrieving files and comparing them repeatedly can add unnecessary effort to everyday Salesforce development work.
BOFC’s Compare and Sync feature brings this workflow into its native Salesforce workspace. Developers and administrators can compare Apex classes, triggers, Visualforce, LWC, Aura, and email templates side by side, identify differences through visual highlighting, and synchronize selected components between connected orgs.
Whether you’re managing multiple Salesforce environments, working across client orgs, or reconciling production changes, BOFC helps make cross-org code comparison and synchronization simpler and more efficient.